Using the Analyzer
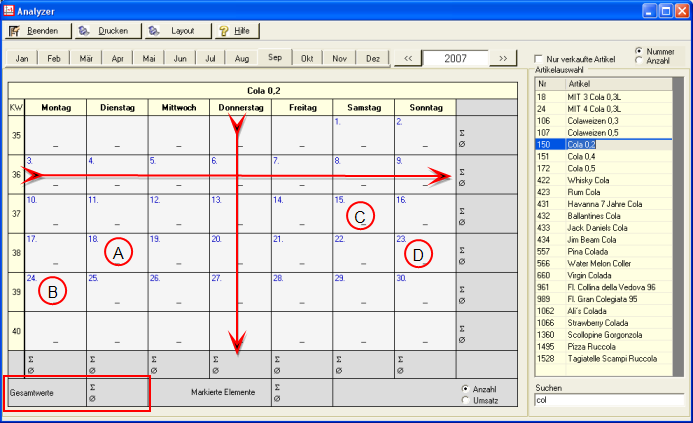
The Analyzer displays your bookings per calendar day. In addition, the historical weather data can be displayed per calendar day. You can check whether the sale of the items on certain selected days behaves differently, by also allowing the operator or the team to influence it, by marking the corresponding days on which the operator or the team works and comparing the sums formed with other days.
Start the Analyzer from the Backoffice Suite programme group:

At the end of each row and column, the corresponding total and average can be displayed. Click on the column header of the weekday or calendar week.
The total value appears in the lower area. In the Selected elements area, you can freely select the fields that are to be totaled (represented by circles A-D).
| Element / Switch | Function / Description |
|---|---|
|
Year selection and monthly selection |
Since the view is always for a specific month, select the year and month in the upper pane. |
| Show only booked items | With this button, only those items are displayed in the list for selection that have also been booked. |
|
Number and number |
Choose whether the order of the items is determined by the item number or the number of postings. In addition, you can click on the headings in the list to reverse the sorting. |
| Search | Enter a full-text search term in the field that currently displays the applicable items. |
|
number or turnover |
Choose whether you want the calendar to display the number of postings (also with loss postings) or the sales volume of the postings. |
|
and layout |
Press the Print button to print the current view of the analyzer. This is a simple representation so that changes to the layout are limited to the environment or position of the calendar evaluation. |
| Show weather |
For the analyzer to be able to display the weather, this must be set up in the MCP. |
Back to the overarching topic: The Analyzer