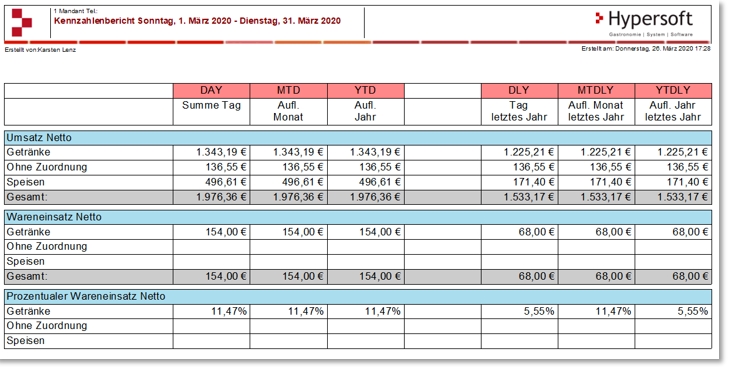
key figure report

On the first page, the turnover per station and main group is listed, including net cost of sales and losses with net equity values.
In addition, the calculation of net sales is shown in the customer average (note: all transactions are the divisor, even those without customer allocation).
The last column is the number of customers calculated based on the number of items and is listed decimally with one decimal place. This value can be relevant using the merchandise category allocation function. The number of customers is not recorded per item but per transaction, so it is a theoretical calculation of key figures.
Further area of the key figure report

In the second part of the report, a comparison with the previous year is made and the report is divided into main groups.
- DAY
- YTD = Year-to-date, the period from the beginning of the current year to the current date.
- MTD = Month-to-date, the period from the beginning of the current month to the current date.
- equivalent DLY, MTDLY and YTDLY for ...Last Year.
Back to the overarching topic: A Hypersoft POS Accounting Evaluations