profile analysis

Profile analysis - making success visible
Profile Analysis is a powerful, graphical evaluation program that you can use to secure and sustainably optimise your business success. Your items are visualised on a clear coordinate cross - from the best-selling to the least profitable products. This allows you to recognise at a glance which items are real top performers - and which potential remains untapped.
How the profile analysis works
Valuable key figures are automatically calculated based on the bookings from the Hypersoft POS system, the mPOS and the webshops. The profile analysis combines:
-
Sales significance - what share an item has in overall success,
-
Sales speed - how frequently and regularly it is sold,
-
Profitability - what economic contribution it actually makes.
These factors create a clear, intuitive picture of your item performance.
Your benefit
With the profile analysis, you can immediately recognise which items will support your offer - and which ones will have a negative impact on the result. This allows you to adapt your menu, your product range or your product strategy:
✅ Strengthen successful items in a targeted manner,
identify and improve weak points,
✅ Align product range and costing with profitability.
This transparency enables you to make faster and more precise decisions and gives your company the basis for measurable growth. The profile analysis is your compass in day-to-day business - objective, automatic and always up-to-date.
Best practice: Tidying up with a system - thanks to profile analysis
In practice, we repeatedly experience menus that are too extensive and unstructured. However, true success rarely lies in quantity, but in clear positioning and consistent quality.
When less suddenly brings more
In many establishments, menus are little novels. But hand on heart: do you really want to be able to do everything - or would you rather be really good at one thing? Because guests can sense when a business has a clear profile. Instead of a culinary smorgasbord, opt for a few real highlights. Or to put it another way:
"The best burger far and wide" sells better than the 43rd pizza variant and 25 fried noodles.
Concentrate on what makes you great - this not only pleases your guests, but also your margin.
A smaller, more focused selection not only looks more professional, it is also more efficient in business terms: kitchen processes are more stable, purchasing and warehousing are optimised and guests experience a clearly recognisable signature. Instead of offering everything that the competition also serves, work specifically on your signature dishes - in other words, what your business stands for:
-
"The best burger in town",
-
"The freshest sushi far and wide",
-
or "The healthiest lunch concept in the region".
A clear focus generates trust, recognition value and higher guest satisfaction.
Continuous optimisation - data-based and measurable
Even if your offer is already compact and coherent, it is worth reviewing it regularly. Create a profile analysis approximately every six months in order to recognise changes at an early stage and strategically develop your product range.
This is how you proceed:
Create the profile analysis for a meaningful time period (e.g. the last 3 or 6 months).
Evaluate the results: Which items make an above-average contribution to success, which stagnate?
Take targeted action:
-
Highlight or promote successful items.
-
Adapt weak positions - for example, through new recipes, portion sizes or pricing strategies.
-
Consistently remove items with permanently low demand.
For this to work precisely, purchase prices and calculations should be stored in the system for all items.
From data tool to success method
Those who use profile analysis consistently transform it into a central management tool for profitability and brand profile. It not only shows what sells well, but also what is worthwhile - and thus enables a balance between turnover, margin and guest enthusiasm. Once introduced, the profile analysis becomes an integral part of your business routine - measurable, objective and invaluable for every operational decision.
Carry out the profile analysis
In the Graphical Evaluations area of the Report Manager, you can choose profile analysis.

Basically it is possible to filter according to categories or items.
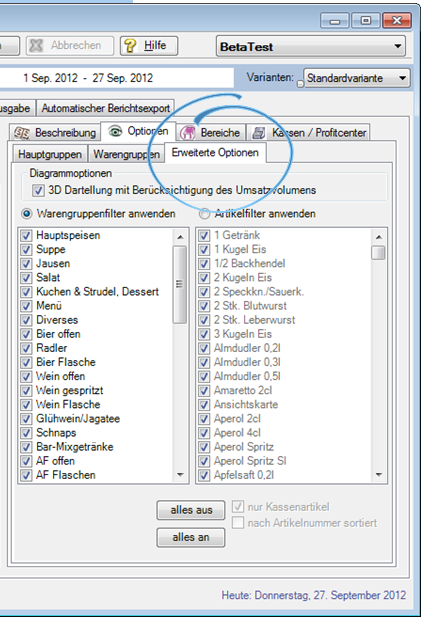
The fewer items compared, the more meaningful the graphic. Optionally the 3D display can be switched off to increase the overview of many data.
You can restrict the list to those items in the item master that currently have the properties "saleable" or "info item" using the Only POS Items switch.
Sort by item number is an option to select the items in the list.

Make the settings and press View.

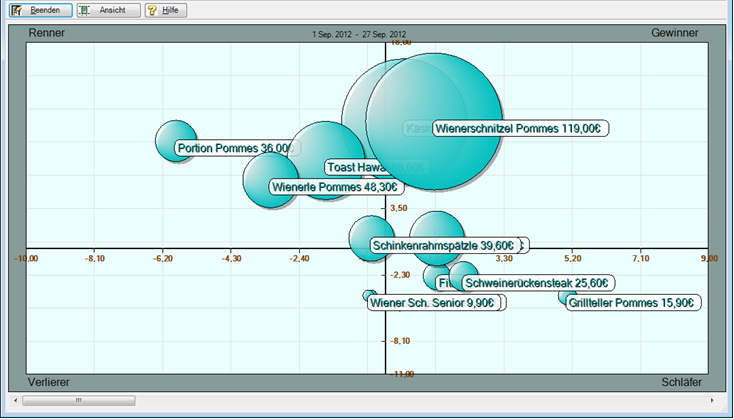
The analysis is calculated and appears:

When you press View, the print preview appears. This consists of the graphic and an additional table display. Example calendar week 35 and 1. until 27. September:
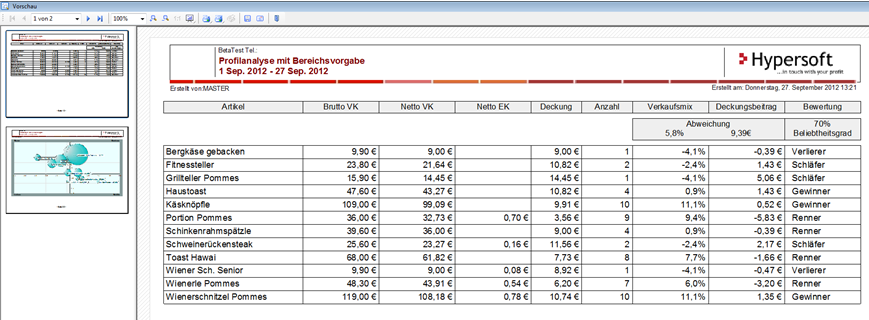
The coordinate cross is calculated for each evaluation. It always refers to the selected period and the contained item bookings. However, the positioning with regard to the four areas is essential.
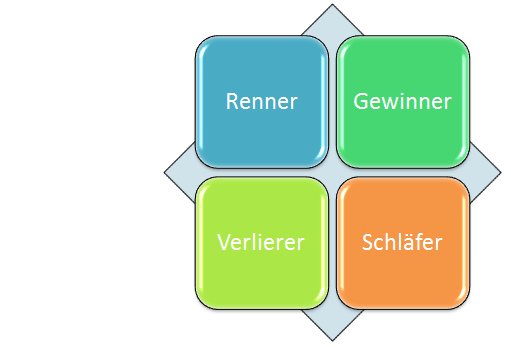

New items are often added to the assortment without listing existing ones. With this analysis, you can decide more safely and easily which items to force and which to give up.
Of course, our consideration and conclusion are only one example that you supplement and change with your experience and knowledge about your company.
Back to the overarching topic: Handling the Report Manager