inventory history
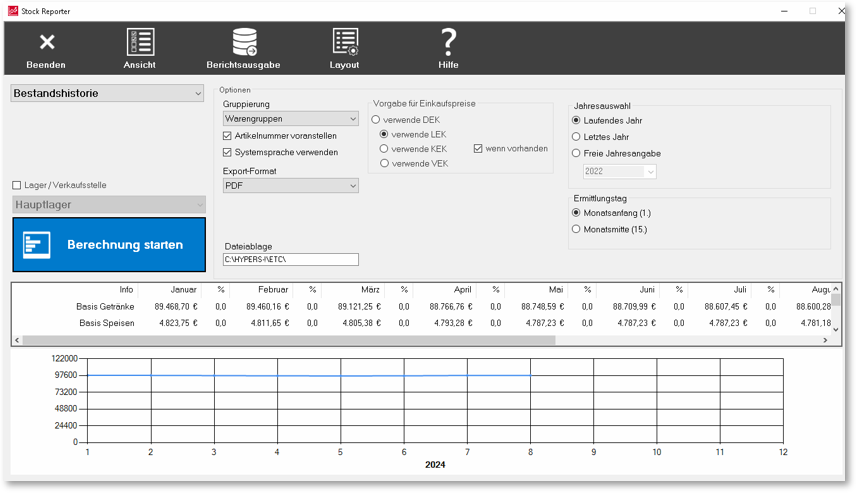
The stock history provides you with an analysis of your stock based on the purchase value and shows the changes in stock over the course of the selected year. The report calculates the portfolio as at 1 January. or alternatively on 15. of the month, allowing you to make comparisons, for example to analyse changes in stock. The value is also broken down by product group.
The percentage shown next to the value indicates how many items have a confirmed stock (other stocks are calculated retrospectively using the cash register entries). The more items that (theoretically) change the stock due to goods postings, the lower this percentage figure will be. The calculation only takes into account the proportion of items with a secured stock compared to the theoretical stock.

Below the table, you see a graphic representation of the position change. The report summarises the table and graph:

The Percentage Evaluation of the Truth Content
The percentage rating of the truthfulness in the inventory history illustrates how reliable the stated value of the goods is. This depends on whether a stock check was carried out and which items were checked in which warehouses or points of sale.
The calculation of the truthfulness takes into account the value of the goods actually checked in relation to the total value of the goods and the number of articles. Cancellations of incoming goods are excluded from this evaluation.
When using the controller, optimised inventory management often leads to a reduction in buffer stock of around 20%, which increases your liquidity accordingly. To achieve this, you should examine and adjust your inventory specifications in a differentiated manner.
Back to the parent page: Stock Reporter Reports