Control settings
The purpose of checking is to record the actual stock of the basic items and your product items and to compare it with the target stock, i.e. the theoretical stock levels. The controller provides you with several methods, settings, and utilities for this purpose.The basic items and products are then assigned to evaluation groups, which represent your opinion in dealing with differences on the item so precisely that deviations in stock are marked accordingly.
Basis of percentage calculation
Before you can start making the valuation group settings, you must define a setting that corresponds to your view of the scale for differences.
Whenever a deviation from stock is determined, this deviation is considered as a percentage. But what is the standard against which we want to measure the inventory?
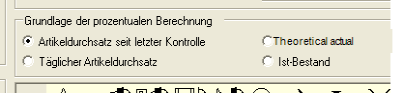
You can choose from four basic options that apply to all evaluation groups:
- Item throughput since last check - If you check an item once a week, the number of its theoretical consumption within that week is taken as the basis here.
- Daily item throughput - This is the average consumption of the item per day as a basis.
- Theoretical actual stock - In this variant, the theoretical stock is used as the basis.
- Actual stock - The stock theoretically available during the check is the basis for determining the difference.
In our opinion, the remaining portfolio cannot be a basis, as changes in the portfolio would also change the valuation. Throughput is more related to an assessment based on tolerance.
Application of the valuation groups
In a valuation group, you can define how the controller is to react to a variance between the target stock and the actual stock. Each item can be assigned to a rating group. Each valuation group can valuate a variance according to the following criteria:
-
Permissible tolerance: there is slightly more or less product than theoretically calculated.
- Loss: The difference is relevant, exceeds the allowable tolerance in the negative, and must be considered a loss.
- Too few goods: The difference is considerable and must be investigated further.
- Better than expected: There is more goods left than calculated by the system, so that, for example, careful handling of the goods can be assumed to be the cause.
- Too much goods: The surplus must be further investigated. The guest receives his drink (for example) with less dispensing quantity than defined in the recipe.
Examples...
When selling fillet of beef you allow 5 % positive and negative tolerance. You want to mark deviating results with a symbol, from 10% negative and 15% positive tolerance you want to get an explanation. Other deviations are not specially marked.
They sell 5.000 bottles of mineral water 0,2lper month. Since it is a piece item, there is no reason why a bottle should be missing. Therefore you set the tolerance to 0% - or the value you want to tolerate.
A deviation in the processing of Parmesan may be unavoidable and will be tolerated by you. Even if it is a valuable raw material. From 15% it is a loss and from 20% you want to have an explanation. A surplus of 25% or more is also questionable and should also be clarified.
- Between 0% and -14.99% there is a deviation within the permissible tolerance.
- Between -15% and -19.99% it is a loss and it has been consumed more than you want to tolerate.
- From -20% it is actually too little product and you have to do further investigations.
- Between 0% and 25% it is better than expected and therefore more goods are available than expected.
- A surplus, i.e. too much goods from 25% is also questionable and should also be clarified.
Example of Parmesan cheese:

The transition from one situation to the next is defined with percentage values. Therefore, 4 percentages are available for five situations. The sixth situation is the state not controlled, which is static. To quickly get a visual impression on the reports later, you can display a different character for each situation that occurs. In our example, we have even removed the characters for Permitted tolerance and Better than expected completely (no graphic is offered for them in the first place of the symbol selection).
You can change our default setting by clicking on a symbol and selecting another symbol from the list below. In practice, it is perfect if the assumed value corresponds to the counted value. The Permissible tolerance setting limits this and determines the transition to loss. If the loss is too high, then it is Too Little Goods *, which you can adjust with the next knob. The value for Better than expected indicates a too high inventory that you tolerate. This can happen, for example, through the thriftiness of their employees. If the value for Too much goods * is reached, this should be used for stocks that can no longer be explained by normal tolerances. The asterisk * means that when the values for Too little goods and Too much goods are reached, a list of previously described reasons for difference must be answered by a predefined selection of reasons (if this query is activated).
The evaluation group 1 could be called this:
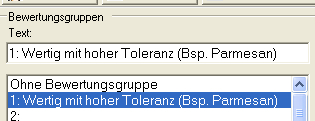
The naming of the evaluation group contains the corresponding information so that it can be easily assigned to other similar items.
Further topics:
Back to the overarching topic: Controller settings