Use Enterprise Reports
In addition to the layouts, the program offers further configuration options and functions largely automatically. When the program is started, an evaluation for the previous day is created automatically.

| Element / Switch | Function / Description |
|---|---|
| Export |
Switches to export. Further topics: Enterprise Reports Export |
| Export Tasks |
Displays a list of export tasks. Further topics: Export Tasks List |
| settings |
In the settings, you can edit the layouts and select the default layout. The default layout is applied when the program is opened. Further topics: Enterprise Reports Settings |
| filters | You can filter between your own layouts and the list of layouts by layout type. |
| layout |
Press the Edit button to open the layout dialog. There layouts can be created, deleted and edited. Further topics: Enterprise Reports Settings |
| period |
With Period you can select predefined periods or enter a user-defined period. The program displays the data according to TTA (standard), but if the display is to take place after the opening day, the layout summary is renewed and additional time is required.
|
| Display |
The switches represent values and columns in the evaluation. This allows you to select the information that is relevant to you. You can display the totals as gross or net. You can also select the amount and number of bookings to be displayed. The average and trends can be shown or hidden. |
| Update |
The program notices a change in the layout or the time period and optimizes the data overnight. If you continue to work immediately after a change, the program may act a little slower than usual. |
| Automatic loading |
You can select the data depth which should be loaded automatically. If, for example, only the main groups are relevant, these can be set as levels. This reduces loading pages and accelerates the work in the program. The layouts for price levels and loss reasons have a corresponding additional level. In the data transfer status, the setting is communicated as level not loaded. The data can be reloaded manually at any time. Instead of a plus sign to expand the line, an arrow pointing downwards is displayed. Pressing this button allows you to view the details for this area only, without having to load the complete layout.
|
| * to sales distribution |
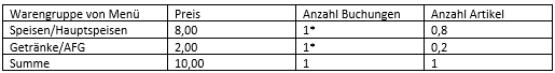
If the evaluation of the postings (not price levels or reasons for loss) includes items with sales distribution, the number of items is marked with a "*" (asterisk). The asterisk indicates that the number is not fully included in the total. The total shows the number of items actually sold, and the number with * shows the number of postings of items in the corresponding merchandise category. Example... An item was booked with turnover distribution of food / main courses 80% and beverages / AFG 20% at a price of 10,00 €, 1 x.
The number of bookings is 1 per product group for each menu, but the menu was only booked once for this. Further topics: Limitations on the splitting of turnover |
| Data transmission status |
The data transfer status shows you the structure of the table. If the automatic loading is restricted, the layer will not be loaded.
Once the display is complete, you can make further settings in the Display area. No further settings are possible during setup. The data transfer status informs you about the progress of the calculations. The program first determines the data of the stores on the basis of the summarized main groups, then calculates the merchandise categories and finally the items.
If optimized data exists for the layout at the time of the update, all stores are determined in one step. If data has to be recompiled, a corresponding message appears. |


evaluations

The evaluation displays the items according to the settings (items that were not posted in the required period are NOT displayed). The Total column contains the sum of the individual rows, followed by columns for each participating store. The Average Ø column shows the trend to the average value of the entire evaluation.
The evaluations are always created on the basis of day-end closings and after transfer of the booking data to MyHypersoft.
| icon | significance | range |

|
Very high tendency | > 200% |

|
Positive trend | 120% ~ 200% |

|
Slightly deviating trend | ± 20% (120%~80%) |

|
Negative trend | 80% ~ 50% |

|
Very low tendency | < 50% |

|
Tendency cannot be determined | 0% |
comparisons
Periods can be compared in the ENTERPRISE report.
Like the period, the comparison period can be selected from a defined range or freely entered. The amount and the number are shown as comparison period and current period with a trend of the development.

The fields that show the comparison values are highlighted in green.
Notes on working with the program
Large data packets...
If there are more than 200 item entries in certain categories, the data is not transmitted immediately to the website, but only when the corresponding product group is opened.

The "Down arrow" symbol indicates that the data has not yet been retrieved there. Selecting the symbol transmits the data.
Staggered message...
Between 200 and 500 data records are subsequently loaded. If there are more than 500 data records, a message appears:
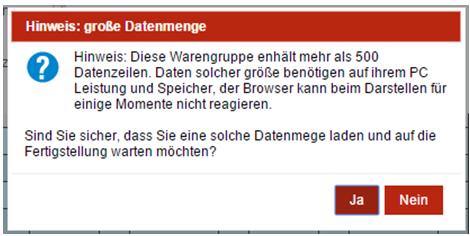
If more than 1000 data records are available, a message appears, because not every PC can work with such large amounts of data:

Cancel the update...
The process can be aborted during the data update. The system waits for the last requested data.

An X indicates the merchandise categories whose data was not retrieved due to a manual termination.
Further topics: Enterprise Reports Settings
Back to the overarching topic: Enterprise Reports & UX/IF Data Transfer