Using Live Report
The Live Report has a responsive design and adjusts the display to the device format.
Display on mobile devices
The Live Report is optimized for use on mobiles . Some special control elements are available for this mobile display.


There are arrows in the views that indicate that additional data is to the right or left of the current view. By pressing them or by swiping to the right or left, the other data is displayed.
Desktop view
The general navigation within the program takes place with elements within the title bar.

Via the module selection you can choose between the views for Live Report, Monthly Overview and Ranking. You can determine the time range via View. In the selection Group you can call up your own groupings or display all locations. If you have locations with different currencies, the selection All locations will be replaced by the corresponding currencies (example: All locations in €).
The current date is set in the middle. Depending on the settings under View, you can navigate a day, a week, a month, or a year forward or backward using the arrows next to the date.
If you want to determine the date, you can first decide whether you want to display a certain day, a week, a month or a whole year. When you have made this selection, a date selection opens:
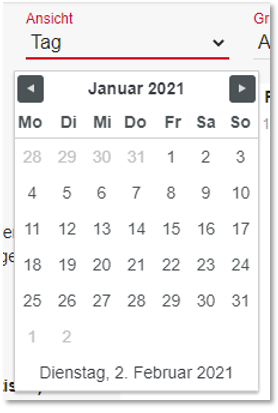
When the current day is selected, the time is viewed and the day after TTA (Theoretical Daily Closure) is displayed.
The amounts are displayed in gross, otherwise there is an indicator such as (net). In certain areas, you can choose between gross and net. Values of 0.00 and 0 are displayed as - in many places for a better and faster overview.
Unless otherwise indicated, values are amounts with two decimal places and an integer represents a number.
Amounts are always in the currency of the sites. Locations with different currencies cannot be mixed, they can be viewed separately.
Live report and information selection
Live Report shows you the values of the sites over a day or over a period of time.

In the categories (turnover, turnover (net), average check, productivity, as well as number of reservations and no shows), the best value is shown in green and the worst in red. In addition to the position (example 6/8 = sixth out of a total of 8 locations), the turnover ranking gives you information via a graphic as to whether the business is in the first, middle or last third.
When you select a location, the detailed view opens (see below).
You can select the information lines in the settings: Settings Live Report Information selection
Calculation of productivity...
Productivity is calculated as follows: total turnover divided by hours worked (if greater than 0). This results in the average productivity in euros that an employee generates per hour.
Monthly calendar and detailed view
Click on the Module selection button to access the monthly calendar. In the monthly calendar you can see the turnover of a month for individual days.

In the monthly calendar, you can switch between gross and net using the selection on the right. Weekends are colour coded to provide an overview. The monthly calendar has a fixed time period of the month.
The detail dialogue
Selecting a location opens the detail dialogue:
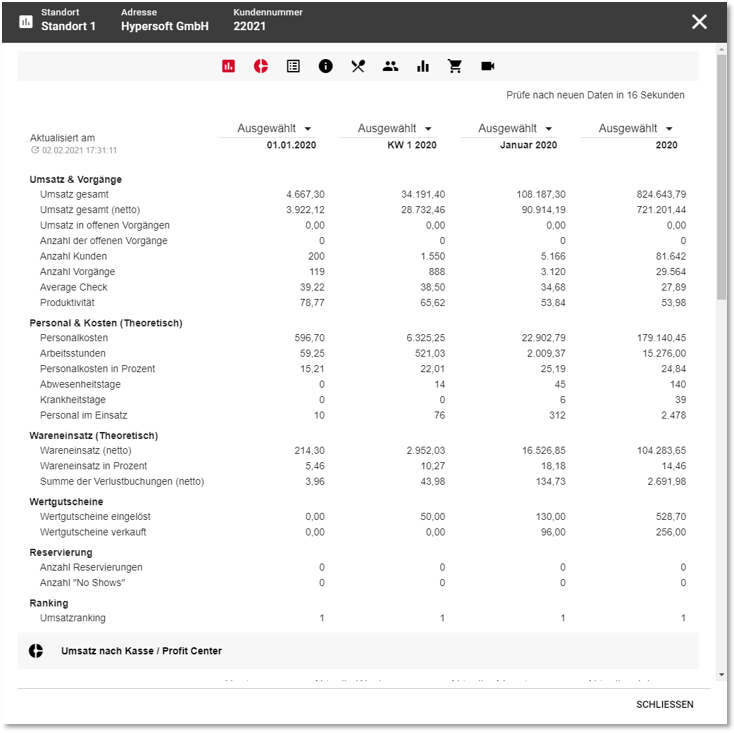
In the detail view, the values from the Live Report for the current day, week, month and year are displayed, but you can change them to any point in time. Furthermore, the sales are also displayed according to cash station or profit center.
If there are currently open transactions (e.g. tables or customer transactions) in the POS system, these are displayed in the detailed view and can even be viewed up to the individual item bookings by selecting them.
With Refresh you can reload the data, via Data from you can see when the data is from. This data is not completely reloaded from the POS system with Refresh, but only the transactions that were present when entering the dialogue are updated.
You can also view the employees' time data here. In addition to the hours worked, the theoretical personnel costs are also calculated (this data is also not immediately loaded from the cash register with Update, but only the existing ones are updated).
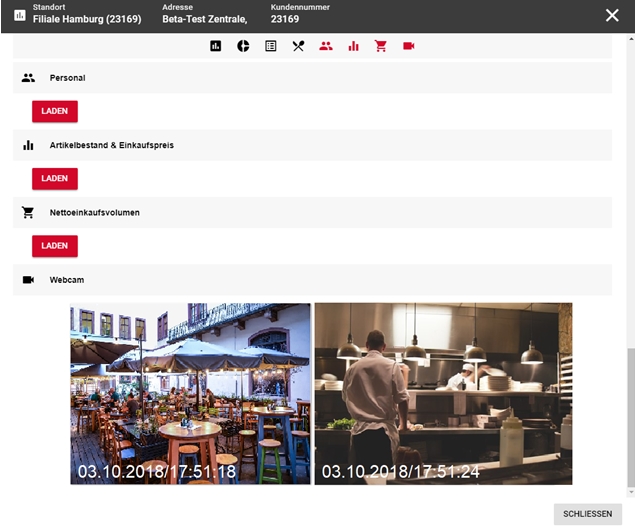
The item inventory & purchase price and the net purchase volume (if the master data of the CONTROLLER were entered accordingly) can be retrieved from the cash register system. The call-up triggers a current calculation and gives the values to the live report after a short time:

The item stock & purchase price and the net purchase volume (if the controller 's master data has been entered accordingly) can be retrieved from the POS system. The call-up triggers a current calculation and returns the values to the live report after a short time. If you want to use this function, please activate the function Support interaction with the portal on the local system in the Hypersoft Lounge.
Turnover comparisons in the monthly calendar

The respective comparative turnover is shown in brackets, while the percentage represents the difference to the current month.
Positive percentages indicate how many % the current turnover is higher than in the comparison month.
Negative percentages indicate how much % the current turnover is lower than in the comparison month.
Evaluation of the report items...
All report items are evaluated separately.

Report items can only be evaluated for the current opening day. Please use the Report Manager for a historical evaluation of report items.
You can display images of your webcams that you use on the Hypersoft webcam distribution list.
Ranking and selection options
Ranking is the default view (displayed immediately) when you open Live Report on a mobile device.
Click the Module selection button to go to the ranking.
In the ranking, the locations in the selected group are compared with each other and assigned a rank. The element Selection provides you with numerous alternative values for your ranking, which allow you to rank not only turnover but also other areas such as reservations and time recording.
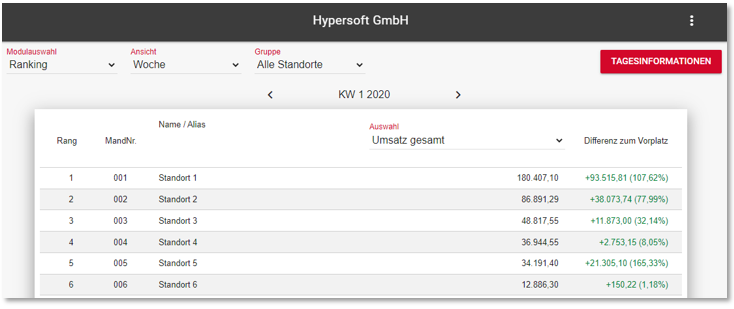
Next to Rank, Location Name and Value, the projection (difference) to the next inferior location is displayed.
A rank/place can be awarded twice if the values are the same.
Sales comparisons per location...
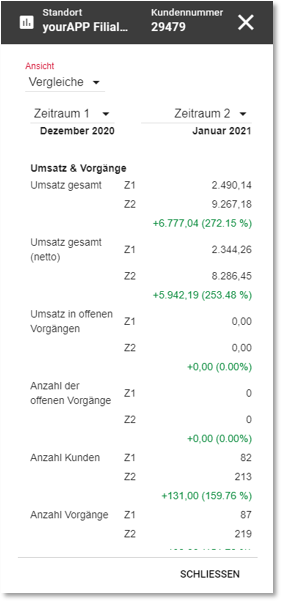
In the detailed view of a location you can switch between the turnover view, as well as the comparisons -view via the button view.

For comparisons you can define a comparison period 1 and 2:

Period 1 can be freely selected:


Period 2 has the appropriate selection day, week, month or year already preselected and can then still be set to the desired date:

Under Period 1 and Period 2, the respective turnover and key figures are displayed:

Under the column Comparisons are compared and the change is shown as a value and as a percentage.
Positive changes are shown in green .
Negative changes are shown in red.
In the mobile view, periods 1 and 2 are abbreviated as Z1 and Z2:
Live data and update
If you have included the current day in the period under consideration, the current bookings are also included in the live data display. The Live Report checks every 60 seconds whether data is available and updates it. When an update is initiated, the reloading of the current view is announced by a countdown above the tables. You have 15 seconds to turn off the update. The update is only reactivated when the view or period is changed.
In the case of live data, the last time of the update is also communicated for each location.
Static Settings
The live report checks every 60 seconds whether there is new data. The abort time to 15 seconds
You can export and download any representation as a table using the three-point menu. Click the CSV icon to download.

Please note that the detailed view cannot be exported.
The export always contains the most current data. Even if you have switched off the updating of live data, the export uses the most current data possible (not outdated representations).
The weather data are only shown in the day display. For a period of several days, the weather data is hidden.
Further topics: Use weather data
three-point menu
On the right side of the title bar you will find the button for the three-pointmenu .
With this you can:
- Edit settings
- Create and edit groups
- Sort & Hide
- Export & Download
- Assign Alias
See this: Live Report Settings
Problems with data retrieval
It can happen that a location cannot be displayed, examples: Location does not have the current or compatible program version, no Internet available, the currency does not correspond to the currency of the other locations, the Hypersoft Lounge interface or Live Report activation is not set up correctly, or the operation has not yet been opened. In these cases, its background area is displayed in light red. You will get a hint and the possibility to hide the location by clicking on it.

For new locations (which do not yet have a Hypersoft Lounge interface), you can start the activation transaction by choosing Select. You will automatically receive the password to connect to the Hypersoft Lounge. Look at this: Activate Hypersoft Lounge
calculations
Example of the calculation. Also consider Limitations and methods.
Reservations...
The "number of reservations" results from all reservations minus cancelled reservations.
The "Number of No Show" results from all reservations not yet checked in that are older than the current server time. If guests arrive a few minutes later, the No Show value may decrease again.
Intervals and waiting times
Retrieving the information for the item stock & purchase price area takes about 60 seconds.
Back to the overarching topic: live report