Configure report output
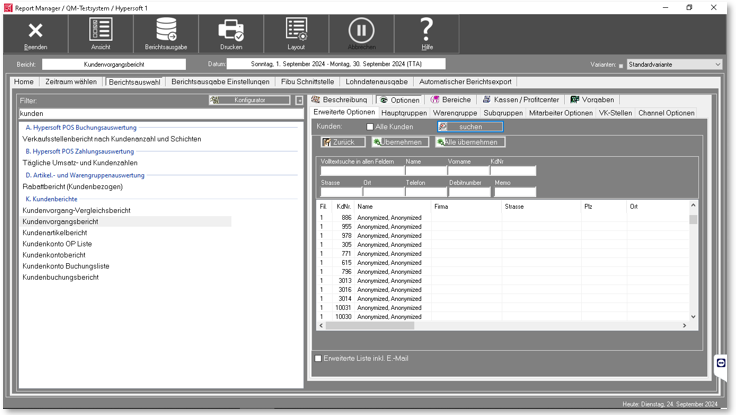
Each manual creation of a report leads you through three steps:
- On the Date/Time tab, start and select the period whose data is to be used for the report.
- Switch to the Report Selection tab and select the report according to its name.
- Select the view, the printout or the report output (creates the report as a file) from the upper button bar.
The Report Manager displays today's date and uses the Open Date option. Use the two calendars to select the beginning and end of the period for which you want to create a report. In the lower area you can select the most frequently used time periods. For example, you can choose Month to evaluate the current month.
The evaluation period
Details about the buttons and elements of Date / Time:

| Element / Switch | Function / Description |
|---|---|
| Calendar |
The calendars indicate the start time on the left and the end time of the data to be used for the report on the right. Further topics: The Calendar |
| daytime range |
You can set a valid range in the daytime range so that only data from this time window is used. For example, you are interested in a merchandise category report for lunchtime between 12:00 and 15:00. Activate the option Include times to define the range by specifying the time from and time to. |
| opening day or booking day, - time |
Normally you select the opening day here. If you select Posting time, the selected system date and time is used at the time of the postings. The time can only be selected for the alternative booking day and time. With the option /TTA reports can be restricted until then. Further topics: Daily closing, daily change and TTA |
| Defined time periods | You can use terms such as previous year or quarter to quickly select common time periods. |
The report selection
Details about the buttons and elements of report selection:

| Element / Switch | Function / Description |
|---|---|
| List of report types |
Select the required report from the list. The reports are grouped and sorted alphabetically. |
| Description of the |
You receive a short description of the contents of the report. |
| domains |
Areas are groups of table numbers that allow you to create custom areas independently of profit centers (which can contain groups of tills). You can select any area for each report.
The areas that you define are available to all reports that are capable of area reporting. Since reports do not use ranges by default, you must first enable the application of ranges by enabling Consider Range Defaults. Further topics: Activate and set ranges. An area has a freely selectable designation and ascending table numbers from tableto table. Enter the name and the area and confirm with Save. Be aware of the following consequence: overlapping and thus double inclusion of tables in groups is allowed at this point. But this can mean that the same entries are included in the report more than once, i.e. the report totals increase due to the multiple evaluation of these. |
| Options for the |
Selecting the Options tab opens further tabs, which are available with settings depending on the report. Product groups... The selection of merchandise categories means that only bookings that belong to the selected merchandise categories are taken into account. The advanced options are very different for the reports: Hourly frequency reports... Hourly frequency reports can be changed to half an hour. Number of customers.... You can calculate the number of customers using the entries at the checkout, or make a customer out of each transaction, or use any item bookings to determine the number of guests. For example, by booking covers. See the chapterNumber of customers for better analyses the number of customers. The per capita turnover can be assigned to different participants. Price levels... Consideration of levels and loss reasons allows you to limit reports to the selected objects. Payment methods... The selection of payment types and payment categories is especially intended for payment evaluations. Employee selection... Some reports can be restricted to specific employees in the options. VAT groupings... The grouping according to VAT rates is particularly interesting when certain operating results can be evaluated on the basis of VAT rates. Comparison reports... The possibility to create comparison reports is particularly strong. Here you can compare two groups and select any price level and loss. Team building... Team formations can, for example, be evaluated in the revenue breakdown. clients |
| profit centers |
Profit centers are groups of tills that you can select here to limit your reports to the selected tills. Profit centers are not defined in the Report Manager, but in Care Unit Management. Further topics: Set Up Profit Centers |
Show and hide best practice reports
To make it easier for you to find the reports you want during your regular sessions with the Report Manager, we recommend that you simply hide all (currently) unnecessary reports in general. This way, you will only ever have the reports in the list that really interest you.
In the Report Manager, you can determine which reports are displayed to you for selection in order to increase the overview:

To do this, select the Configurator button in the Report Selection tab. Here you can show and hide the reports as well as use the list generator.

To adjust the status of a report, select it (multiselection is also supported). Choose Lock so that the report is no longer displayed on the Report Selection tab when you work with your logon. In the Use column, this is removed from the selected reports to provide an overview of your settings. To reuse locked reports, select them and switch to Use.
Press the Save button to save the settings and the Exit button to return.
With the For All option, you also determine whether the switch to Use or Locks should apply to all users. In this way you can easily determine the overview for all your employees.
Options and settings
The report settings vary per report. Whenever you select a report from the list, you will be offered the possible settings for it on the right-hand side.

The settings are saved per ward number (and not per user). This allows each work center to define its own settings.
You can restrict or select merchandise categories according to the report type.
In the lower area there is the option button Applysort number of groups. This option switch is used to deactivate the sort number, because it can happen that sort numbers occur twice and then apparently unsorted reports appear.

Support Main and Merchandise Category Filters per Variant to determine whether different Main and/or Merchandise Category Filters can be set for each Variant.
Normally, all items are included in reports. With this option you can freely select the items. If you have marked items as report items, you can have them selected and then make further adjustments.

The advanced options differ depending on the selected report.
Since every voucher booking, both the sale and the redemption, is saved with the voucher number in the booking journal, some item booking reports can result in a lot of pages in the printout, if the voucher number is not important, but only the sum of the bookings, you can condense this data. The voucher sales and the voucher redemptions are then each summarised as one line in the report.
Advanced options: Number of customers...
Here you can set the characteristics according to which the number of customers is to be determined.

Further topics: Number of customers for better analyses.
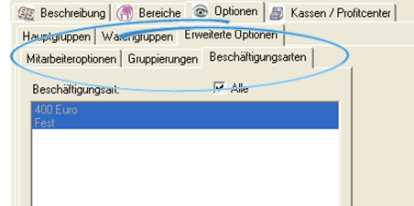
Advanced Options Staff Options...
If the reports are about employees, you can restrict the employees by selecting individual employees, groups, or employment types.

Advanced options: Customer search...

The customer search can take place by customer number. The search also supports wildcards. A customer number range can be searched for and filtered. The characters _ (underscore), x and X are supported.
Example 1: 5__ = all customers from 500 to 599
Example 2: 1xxx = all customers from 1000 to 1999
Further topics: G Customer count and transaction evaluations
Advanced Options: Channel Options...

It is possible to select individual channels to limit the content of the report output to the selected channels. This selection can also be selected per variant. Example of channel reports: Channel Channel Payment Report, Channel Item Report, Channel commodity groups report Report.
Some reports take into account the range specification based on table numbers or customer numbers. If, for example, an area such as the restaurant and the cocktail bar is to be delimited on the basis of the table numbers, you can define and evaluate the areas on the basis of the numbers. This is particularly useful when operators are working in multiple reports and therefore cannot use the operator evaluations.

Control areas using variants...
If, for example, an area such as the restaurant and the cocktail bar can only be differentiated on the basis of the table numbers and the accounting areas are managed by different people, you can, for example, create a variant for restaurant with table number range 1-999 and a variant with table number range 1000 - 2000 and mail the differentiated reports to different people. Here in the example, reports for the cocktail bar to Mr. Mustermann:

See the topics Use Report Manager variants and Automatic report export area.
Daily time of the weather data
If you have set up the weather data, you can also display the weather for certain reports. It is necessary to select the daily time for this, as only "one weather" is displayed per day, even for intraday changes.

In the standard system, the weather data is used daily at 12:00.
Output options of the Report Manager
After you have made all the settings, you can choose how you want to receive the reports. You can choose between view, report output or printing. To begin with, we recommend that you select the view so that you can decide whether the desired report meets your expectations.

The View (Preview)
In the view you get a preview in which you can navigate and print. The view or preview
Printing and outputting lists
Use the Print button to print the report or data to a printer. The print selection dialog
The layout function...
Hypersoft Suite enables you to make extensive arbitrary adjustments to most lists and evaluations with the program List & Label Layouter . This is started with the Layout button next to the Print button. The layouter should only be used by experienced users or after training. You can also instruct us with adjustments at any time. Further information can be found at The List & Label Designer.
Further topics:
Back to the overarching topic: Report Manager